Real-Time Monitoring
Visualize current system status and processing queues that update automatically every 5 seconds.
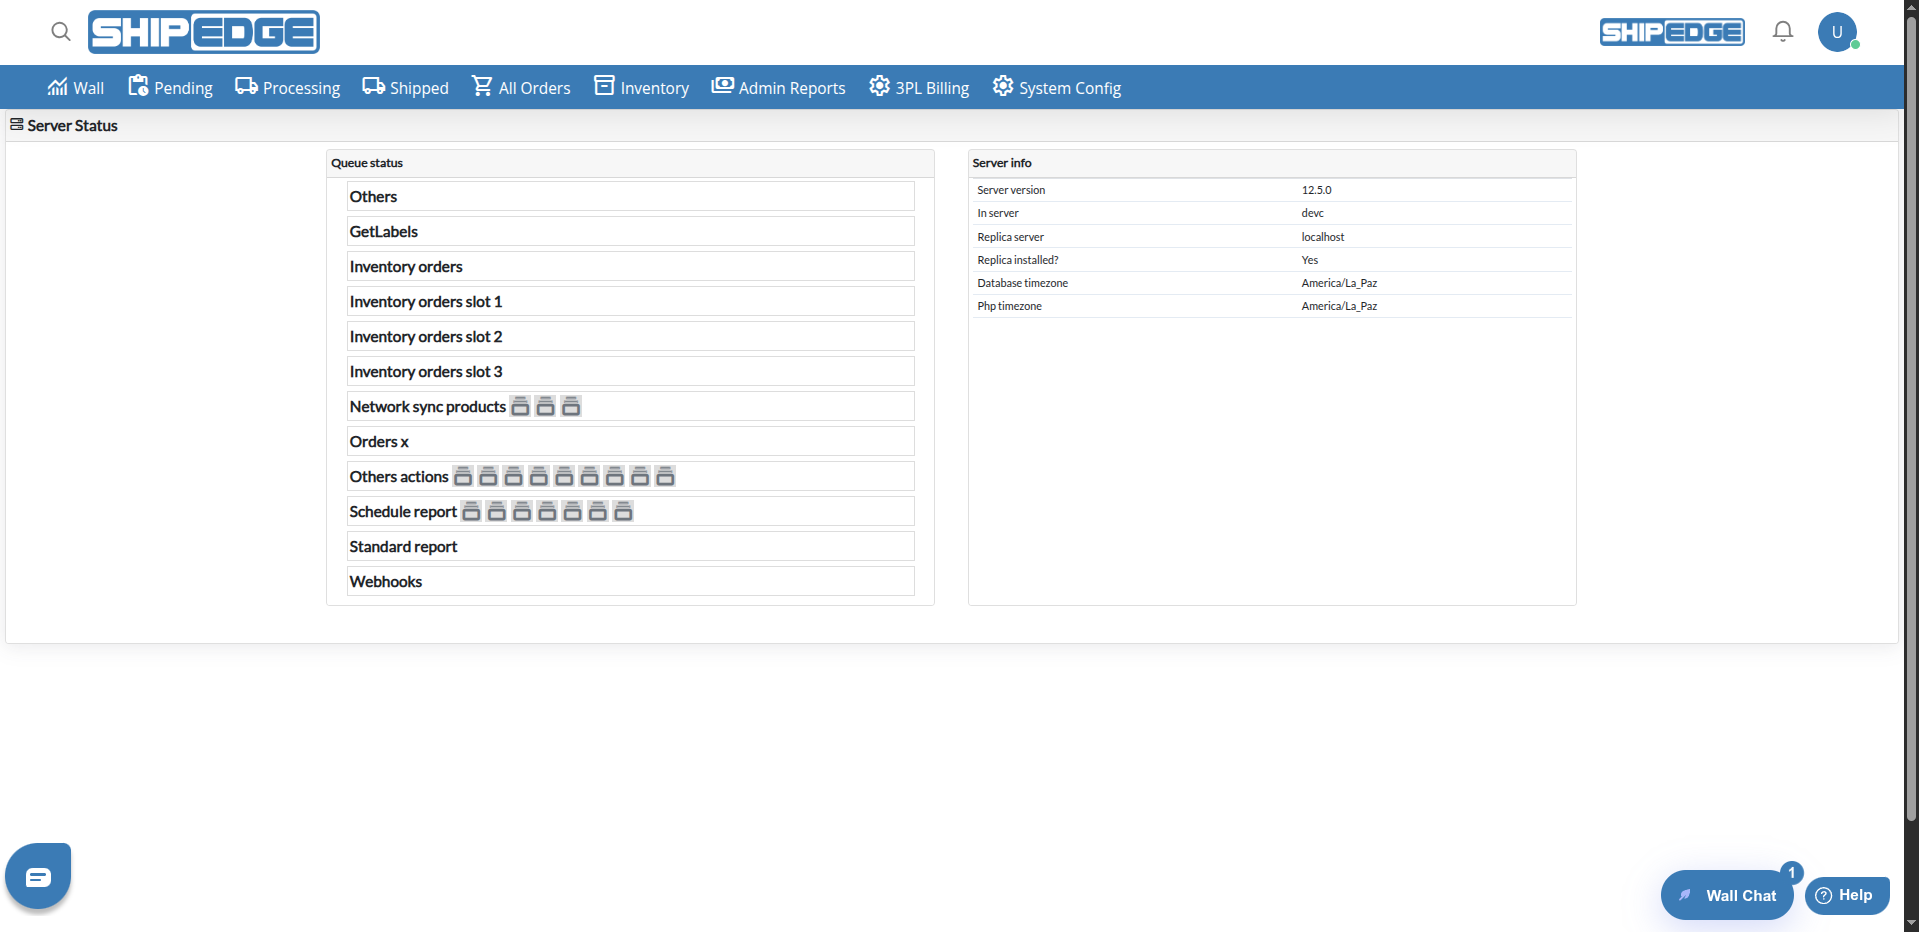
Server Status is a technical monitoring view that shows real-time information about server status, system configuration, processing queues, and infrastructure details. This tool helps administrators and technical staff diagnose problems, verify configurations, and monitor system performance.
Server Status automatically updates queue information every 5 seconds to maintain constant visibility of system status.
Visualize current system status and processing queues that update automatically every 5 seconds.
Identify configuration problems or blocked queues quickly from a single view.
Access server technical details and timezone configuration from the health check API.
Review processing queue status and item details to track system activity and troubleshoot delays.
Navigate to System Config
Go to the main menu and click System Config.
Select Server Status
Click Server Status from the System Config submenu.
Review Information Shown
The page shows cards with Server info (merged with timezone configuration) and Queue status. Queue data updates automatically every 5 seconds.
Server Status shows two main sections.
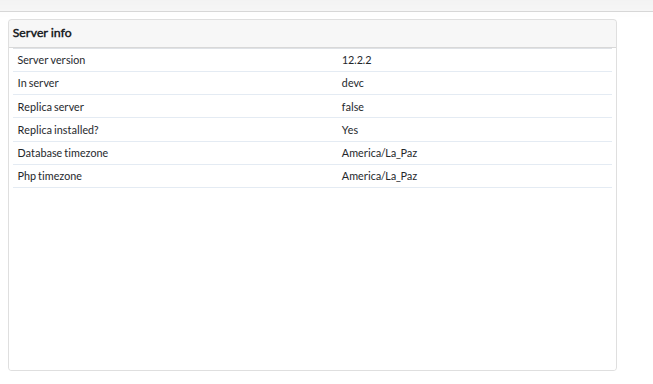
A single card that combines Server info and Timezone configuration from the health check API. The exact fields depend on the API response but may include:
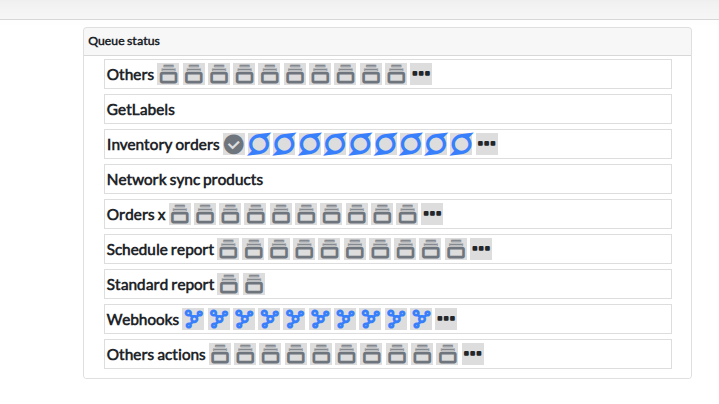
Shows real-time processing queue status (action: fetch_queue_activity_log).
Icons and names in queues represent different process types:
Click on a queue item or “Show more”
Click on a queue item (icon) or the “Show more” icon (three dots, ellipsis) to see all items in that queue.
Review details table
A modal opens with the queue name. If the queue is empty, you’ll see “Queue [name] Empty”. Otherwise, a table shows:
View details of specific item
Click the information button to see the complete item payload in JSON format.
✅ System Working Correctly:
⚠️ Possible Problems:
Review Server Status periodically to detect problems before they affect daily operations.
Pay attention to queues that have many accumulated items. This may indicate slow or blocked processes.
After server updates, verify the Server info section shows the expected configuration.
Use the Server info section to track server configuration and version. Document any changes for troubleshooting.
Possible Causes:
Solution:
Possible Causes:
Solution:
Possible Causes:
Solution:
/apiv2/internal_health_check/info API is accessibleHow often is information updated?
Can I export this information?
Currently there’s no integrated export function. You can take screenshots or manually copy the information you need.
What do I do if I see queues with many items?
If a queue has many accumulated items:
Why don’t I see the Queue status section?
The Queue status section always appears. If all queues are empty, you’ll see the message “Great job! The queue is empty” with a check icon.
What does “Replica Installed: No” mean?
If this field appears in the Server info section, it means there’s no replica server configured for high availability. This is normal in standard installations and doesn’t indicate a problem.
Explore Related Features: